


Republican lawmakers said Utah’s 2021 congressional map gave the state balanced representation in Washington, D.C. Critics said it was gerrymandering for Republican candidates. But the data shows something much more calculated: a ruthless strategy that split Democrat Joe Biden’s 2020 voters so equally across all four districts that the variations were less than 4 percentage points.
When Utah Republicans unveiled their 2021 congressional map proposal, they had a simple message: every district should represent both urban and rural interests.
“The congressional map we propose has all four delegates representing both urban and rural parts of the state,” Sen. Scott Sandall, co-chair of the Legislative Redistricting Committee, said in a press release when the maps were unveiled.
“Rural Utah is the reason there is food, water and energy in urban areas of the state. We are one Utah and believe both urban and rural interests should be represented in Washington, D.C. by the entire federal delegation.”
While the map did achieve that urban-rural combination, it also engineered four congressional seats that would be safe for Republicans for the next decade.
Last week, Third District Judge Dianna Gibson threw out Utah’s congressional maps, ruling that the legislature violated the Utah Constitution when they repealed Prop. 4, a citizen-approved ballot measure that established an independent redistricting commission.
The ruling validated what critics had argued in their 2022 lawsuit, that Republican lawmakers had “cracked” Democratic areas apart to create safe seats for Republicans.
The roots of the current situation trace back to 2010, when the state was given a fourth seat in Congress following the Census. During the 2011 redistricting effort, Republican lawmakers saw an opportunity to take aim at Rep. Jim Matheson, the state’s lone Democrat in Congress. They engineered Matheson’s 2nd Congressional District to be overwhelmingly Republican, somewhere between 60% and 65% depending on who you asked.
While the map did make it as hard as possible on Matheson’s re-election chances, it also led to a costly mistake. In creating the new Fourth District, they accidentally drew what would turn out to be an unexpectedly competitive seat.
That miscalculation created the state’s only competitive congressional battleground. Over the next five election cycles, Democrats won the seat twice with victory margins of under 1,000 votes each time. The district’s average margin of victory for the five elections between 2012 and 2020 was 8,800 votes. That’s why Matheson shocked the Utah political establishment by abandoning the Second District to seek the 4th District seat, which he won by defeating Republican Mia Love in 2012.
When the 2021 redistricting cycle rolled around, legislative Republicans were determined to fix their 4th District headache.
Here’s how they did it.
The most obvious evidence of gerrymandering on the 2021 congressional map is the weird four-way split of heavily Democratic Salt Lake County. Under the 2011 map, Salt Lake County was only divided three ways across the Second, Third and Fourth districts.
The 2021 map also splits up Utah’s registered Democrats almost equally statewide across the four districts. But targeting Democrats alone wouldn’t be enough. After all, registered Democrats make up just 13% of Utah voters. But Democratic candidates consistently outperform that number. In 2024, for example, Kamala Harris received 38% of Utah’s statewide vote - nearly triple the percentage of registered Democrats.
So Republican mapmakers took aim at something more precise: actual voting patterns by targeting the broader coalition of independent and unaffiliated voters who tend to support Democrats.
Analysis by Utah Political Watch, using precinct-level data from Redistricter, revealed their strategy. Instead of focusing on registered Democrats, it appears that Republican mapmakers used the 2020 presidential election as their blueprint. They carved up Biden voters with mathematical precision across all four districts:
- CD1 - 25.51%
- CD2 - 25.59%
- CD3 - 26.54%
- CD4 - 22.36%
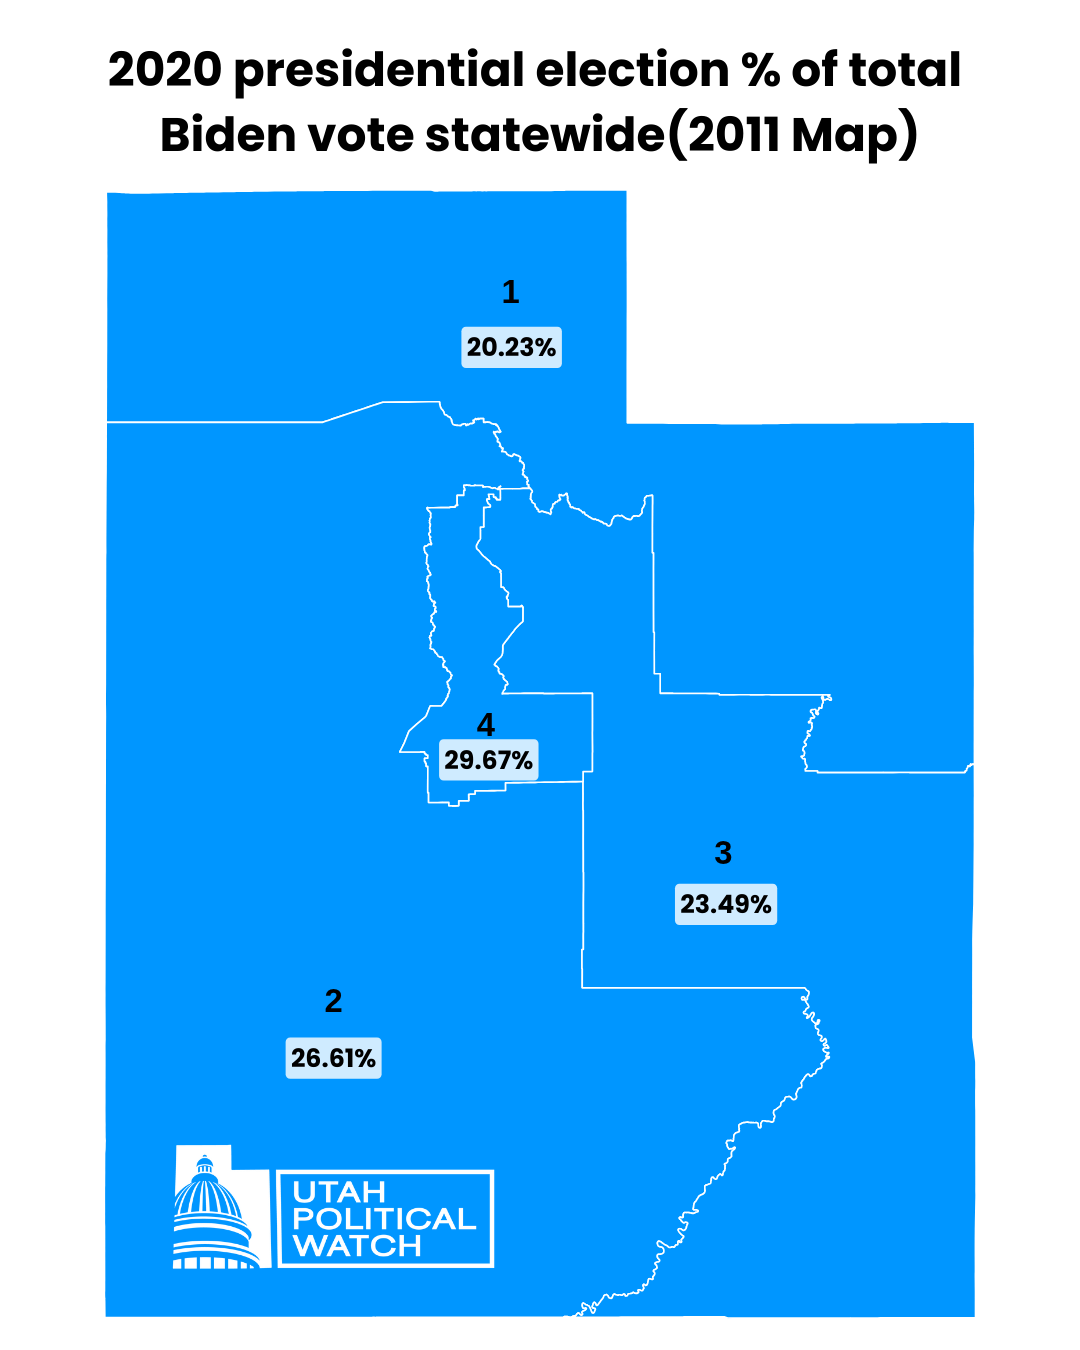
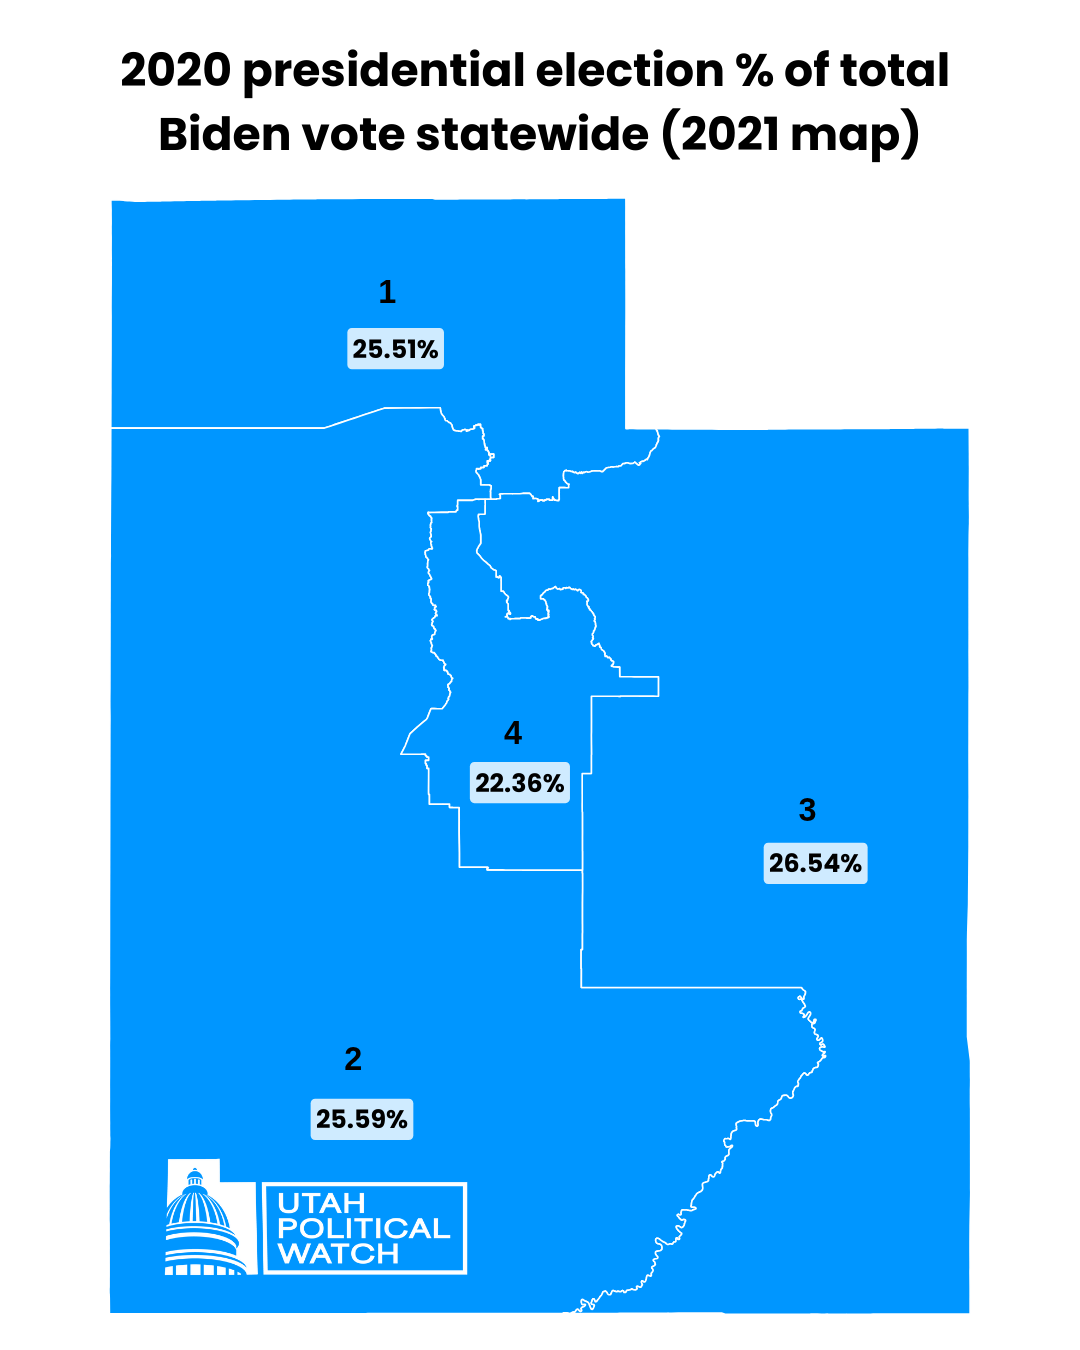
Before redistricting, CD4 accounted for nearly 30% of Biden’s statewide voters. The new map slashed that to just over 22% while simultaneously boosting Republican Donald Trump’s vote share from 23% to 25%, transforming CD4 from a potential battleground district into a reliable Republican stronghold.
- 2020 margin (old map): Trump +11 points
- 2021 map projection: Trump +26 points
Outside of the 4th District, the shift in Biden and Trump voters was much smaller.
- CD1 became more Democratic, as the number of 2020 Biden voters in that district increased by more than 5%, while Trump voters decreased by about 2%. Trump carried this district by 32 points in 2020. Under the 2021 maps, that margin would have been about 20 points.
- The percentage of Biden and Trump voters decreased slightly in the 2nd District. The overall impact was negligible, as Trump’s margin of victory was essentially the same on both the 2011 and 2021 maps.
- The 2020 Biden vote increased by 3 percent in the 3rd District while the Trump vote remained mostly unchanged. Trump’s margin of victory would have dropped by about 5 percent had the 2021 maps been in place.
In a statement to Utah Political Watch, Sen. Sandall defended the maps that he helped spearhead during the 2021 redistricting process.
“The concept for the map actually originated from a college student who submitted a design resembling a pizza. We took that idea and developed it further, spending hours refining it into precise lines that ultimately balanced to zero,” Sandall said.